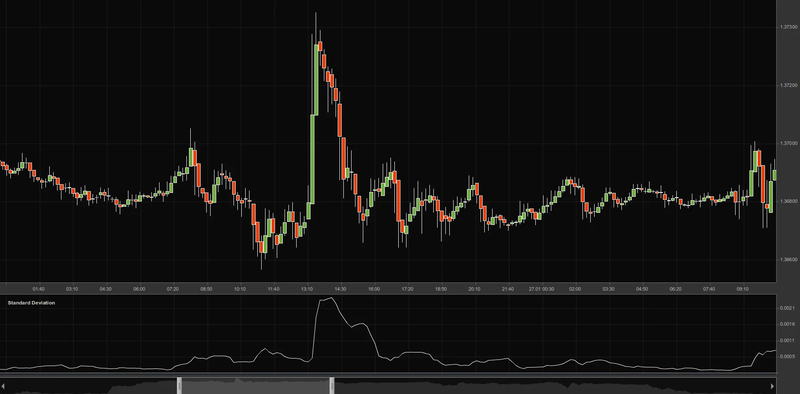
For traders and investors in the volatile world of cryptocurrency, knowing how to assess market movements is critical. Two key concepts that can provide deep insights into price trends are the trading range and standard deviation. In this article, we’ll explore these concepts in detail and explain their application to Kaspa (KAS).
What is Kaspa (KAS)?
Kaspa is a fast-growing cryptocurrency designed with innovative blockDAG technology. Unlike traditional blockchain systems, Kaspa’s architecture enables ultra-fast transactions and scalability while maintaining decentralization. These features have made Kaspa a promising option for investors seeking high-performance cryptocurrencies.

However, like all cryptocurrencies, Kaspa’s price can be highly volatile. This is where metrics like trading range and standard deviation come in handy, offering insights into its price behavior.
What is the Trading Range?
The trading range is the difference between the highest and lowest prices of an asset over a specific timeframe. It provides a snapshot of the asset’s price fluctuations during that period.
Formula: Trading Range = Highest Price − Lowest Price
Why is it Important?
- Identifies Volatility: A wide trading range indicates significant price swings, which could mean higher risk and reward.
- Helps Set Targets: Traders can use the range to set entry and exit points.
Example for Kaspa: If Kaspa’s price fluctuates between $0.02 and $0.035 over a week:
Trading Range = 0.035 − 0.02 = 0.015
This means the price moved within a $0.015 range during that timeframe.
What is Standard Deviation in Trading?
Standard deviation measures how much an asset’s prices deviate from their average value. It’s a key indicator of market volatility. A higher standard deviation suggests more significant price swings, while a lower value indicates price stability.
Formula: Standard deviation involves a step-by-step process:
- Calculate the average price over a specific period.
- Find the deviation of each price from the average.
- Square these deviations.
- Compute the average of the squared deviations (variance).
- Take the square root of the variance to obtain the standard deviation.
Significance in Trading:
- Quantifies Volatility: It shows how erratic the price movements are.
- Risk Assessment: A high standard deviation implies higher risk, while a low one suggests stability.
- Trend Analysis: Helps predict whether prices are consolidating or about to break out.
Step-by-Step: Calculating Standard Deviation for Kaspa
Let’s break down the process with an example.
Gather Price Data: Assume Kaspa’s daily prices over a week are: $0.025, $0.028, $0.03, $0.027, $0.029, $0.031, $0.033
Calculate the Average Price: Add all the prices together and divide by the number of prices:

Compute Deviations: Subtract the average price from each individual price:
- $0.025 – 0.029 = -0.004
- $0.028 – 0.029 = -0.001
- $0.03 – 0.029 = 0.001
- $0.027 – 0.029 = -0.002
- $0.029 – 0.029 = 0.000
- $0.031 – 0.029 = 0.002
- $0.033 – 0.029 = 0.004
Square the Deviations: Square each deviation to remove negative signs:
- $(-0.004)^2 = 0.000016
- $(-0.001)^2 = 0.000001
- $(0.001)^2 = 0.000001
- $(-0.002)^2 = 0.000004
- $(0.000)^2 = 0.000000
- $(0.002)^2 = 0.000004
- $(0.004)^2 = 0.000016
Calculate the Variance: Find the average of these squared deviations:

Compute the Standard Deviation: Take the square root of the variance:

What is the Trading Range of Kaspa Standard Deviation?
The trading range of Kaspa’s standard deviation combines the concepts above. It measures how much Kaspa’s price deviates within a given range, providing a comprehensive view of its volatility.
Using the above example:
- Trading Range: $0.015
- Standard Deviation: $0.00245
This means that while Kaspa’s price fluctuated by $0.015 during the week, its average volatility (standard deviation) was $0.00245.
Practical Applications for Traders

Volatility Assessment:
- A high trading range or standard deviation signals periods of intense activity, ideal for short-term traders.
- A low value indicates stability, suitable for long-term investors.
Setting Stop-Loss and Take-Profit Levels:
- Traders can use the trading range and standard deviation to define their risk tolerance and profit goals.
Market Timing:
- High volatility often precedes significant market moves. Monitoring these metrics helps traders anticipate breakouts or consolidations.
The trading range and standard deviation of Kaspa are powerful tools for understanding price behavior and managing risk. By analyzing these metrics, traders and investors can make more informed decisions, align strategies with market conditions, and navigate the ever-changing crypto market with confidence.
